


In the 1920s, advertiser Fred A. Barnard popularized the phrase, “A picture is worth a thousand words,” as he recommended using illustrations on the side of street cars to promote products.
We now know that Barnard may have re-interpreted the phrase from other sources, and he even later attributed it to a Chinese proverb, but the premise stands the test of time.
And if a picture is worth a thousand words, when it comes to analyzing economic data, a good chart (or ten) is certainly worth far more than that.
Today, we picked a series of charts and graphs that together illustrate the state of our economy. Combined with brief commentary, I feel this aptly narrates the true story of where we are now – and where we may be going next.
Asset Class Performance YTD

*Data through 5/27/2020
Given what we’ve been this year, markets are holding up incredibly well.
Observations:
- The tech heavy Nasdaq 100 (QQQ) is up 8.55% YTD
- The broader S&P 500 index of larger US stocks is “only” down 5.14% YTD
- Riskier asset classes such as US mid and small caps, as well as REITs are down much more YTD. This reflects the economic uncertainty in more sensitive areas of the market. Riskier assets have been punished more – but that’s how investing should be.
- Bonds have mostly done their job in diversifying risk, as both the Barclays Aggregate Bond (AGG) and National Municipal Bond Index (MUB) are positive for the year. Municipalities have had a much more challenging year due to uncertainty in state and local budgets, but have rebounded significantly from their March lows.

*Goldman Sachs Asset Management
If you were feeling uneasy about your portfolio over the last few months, it’s likely because volatility has been off the charts. We’ve experienced a plus 3% or minus 3% move during one out of every four trading days so far this year.
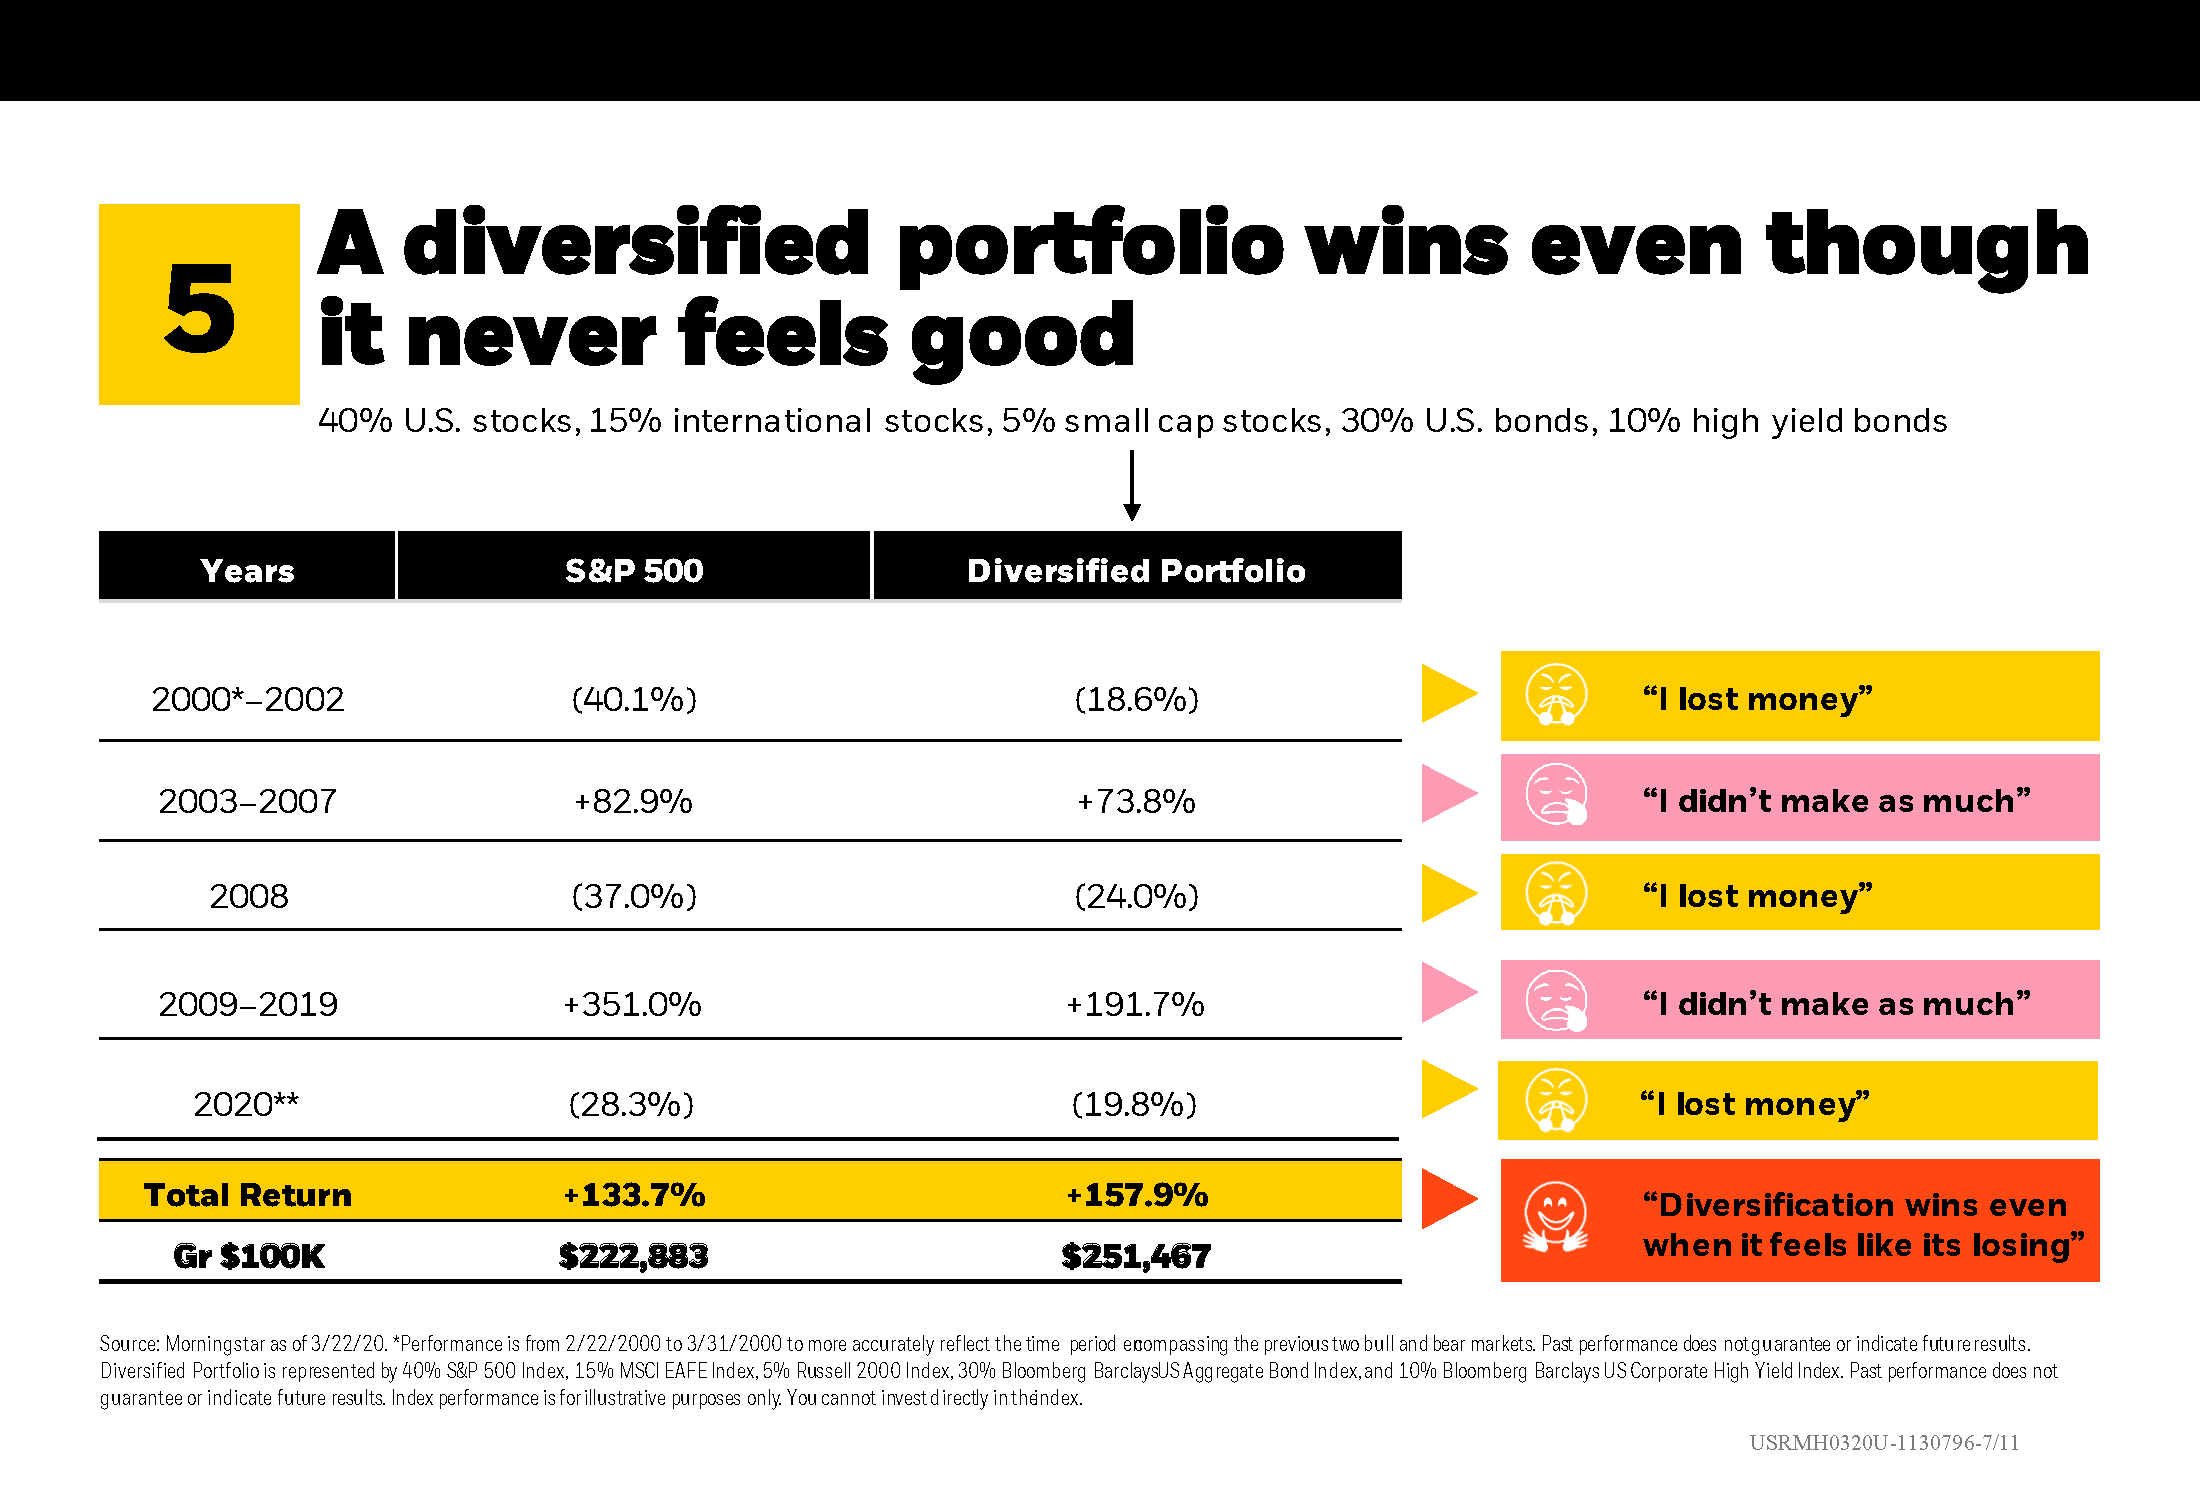
Diversification Never Feels Good
*Source Blackrock
If you look at a diversified portfolio during a short-term period, there’s always something to complain about. Earning less than the market during good times and losing money, even if less than the market, during bad times may not feel great. However, history has shown that diversification is a vital tool for building wealth, even if it doesn’t feel that way most of the time.
Unemployment and Household Finances
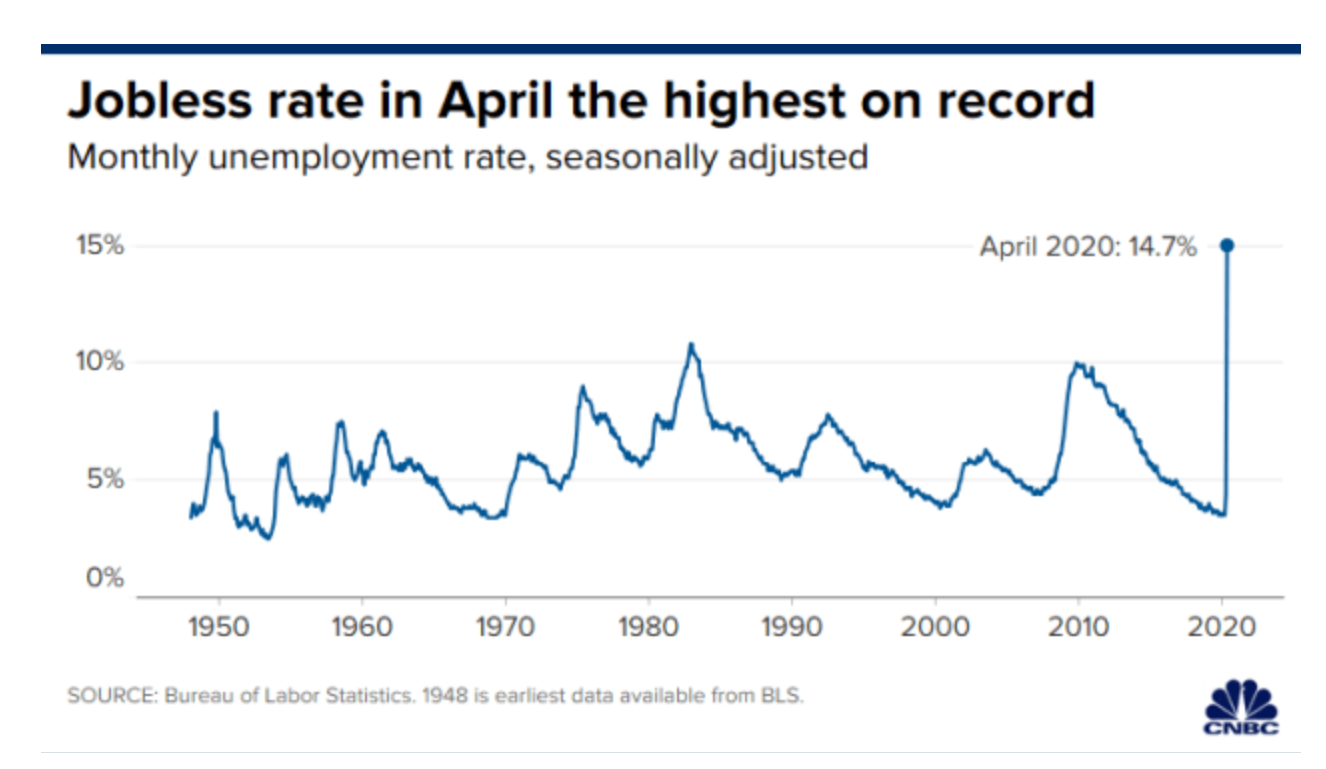
Climbing to 14.7%, the unemployment rate through April was the highest it’s been since the Great Depression. May’s unemployment report will not bring a reprieve, as the unemployment rate for last month is expected to be close to 20%, with over 40 million claims filed in the last 10 weeks.

But there are signs that the rate of new unemployment is slowing. As states gradually reopen their economies, almost 4 million people came off unemployment benefits during the week ending May 16th, a trend that should continue through the summer. Perhaps the worst is behind us and we’ll continue to see improvement as more Americans go back to work.

Clearly, we see that the COVID lockdown has been especially damaging to workers without a college degree. The unemployment rate for those without a high school diploma is almost three times larger than the rate for workers with a college degree.

Despite skyrocketing unemployment and a sharp decline in consumer spending, personal incomes are actually up in 2020! It seems that direct stimulus payments from the government and enhanced unemployment benefits are having their intended effect on the system.
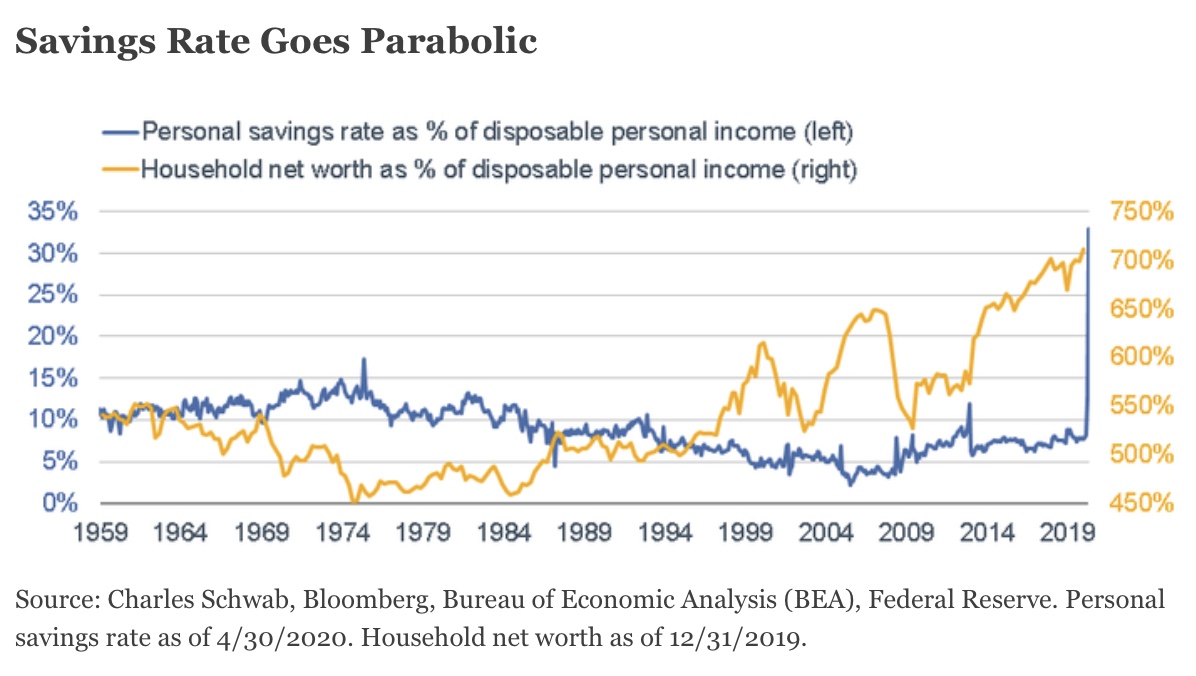
Households have cleaned up their balance sheets since the financial crisis. With personal incomes up, the savings rate has risen astronomically to 33%. If you’re wondering how the stock market could possibly go up while the economy continues to suffer, this is one good reason. As the economy continues to reopen and the jobless rate recedes, the expectation is that increases in income and the savings rate will show up in spending.
Federal Reserve Finances

*Retrieved from FRED, Federal Reserve Bank of St. Louis
After a period of normalization between 2017-2019, Federal Reserve assets have ballooned from $4 trillion to $7 trillion dollars. For reference, in August of 2007, total assets were just $870 billion.
It seems we were in a “heads I win, tails you lose” situation. If the Fed did nothing during the coronavirus lockdown, the economy collapses, and we endure Great Depression 2.0. But if they act aggressively (which they have), we blow up the US balance sheet with debt.
And speaking of debt…
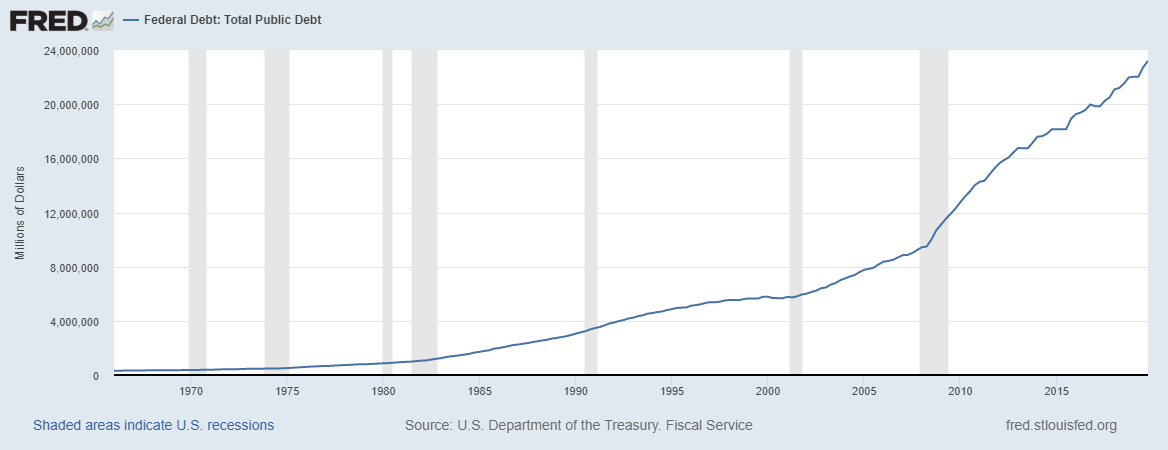
The National Debt coming in to 2020 was closing in on $24 trillion. Add another ~$2.4 trillion from the stimulus package, throw in an estimated $1.1 trillion in operating deficit this year, and our National Debt should be $27.5 trillion dollars by year’s end.

*Source: JP Morgan Asset Management, Eye on the Market 5/26/2020
While that National Debt figure seems ludicrous, the impact to the Federal Budget is not what it may seem. Interest payments on all this debt as a percentage of GDP are nowhere near the highest they’ve been since our current government can borrow at ultra-low interest rates.
Consumer Spending

What gets the economy back on track and will ultimately justify our current stock prices? The health of consumer spending.
In a sign that spending is beginning to rebound, credit and debit card spending has risen from a low in March of -41.8% to -21.6% in May, according to JP Morgan Chase.

TSA traveler throughput (the number of people being screened at airports) is slowly showing signs of improvement, but still has a long way to go to reach 2019 levels. Passengers passing through TSA checkpoints reached a low of 87,534 on April 14th, 2020.
*Source: TSA.gov
Hotel room occupancy is also beginning to rebound from historically low levels.

And reservations at restaurants began spiking toward the end of May. I can’t wait to sit on that back patio at Paragary’s in midtown Sacramento.
Risk and Opportunities
As spring turns to summer, risks and opportunities abound. Will confidence from a retreating number of cases (or news of an effective treatment) continue to bring economic improvement? Or, will a resurgence of the virus in the fall, coupled with a delay in vaccine news, see us slip back into economic contraction?
It seems that either scenario is equally likely at this point, and that’s what drives risk premium in equity markets.
The only way to successfully navigate these uncertain times continues to be through a with a well-defined financial plan and investment process.
Wishing you continued health and safety,
Brian
Information presented is for educational purposes only and does not intend to make an offer or solicitation for the sale or purchase of any specific securities, investments, or investment strategies. Investments involve risk and, unless otherwise stated, are not guaranteed. Be sure to first consult with a qualified financial adviser and/or tax professional before implementing any strategy discussed herein. Past performance is not indicative of future performance.